Additional Resources
Tables and Figures
Tables and figures are used to display quantitative information. Readers find technical information easier to understand when the description or discussion contains a visual element. Tables and figures do not replace technical information; rather, they make it easier for readers to understand large quantities of data. When organizing data, keep the following in mind (Knisely, C.W. and Knisely, K.I., 2015):
- If the results can be stated in one sentence, no visual is needed.
- If the numbers are more important than the trend, use a table.
- If the trend is more important than the numbers, use a graph.
General Guidelines for Tables and Figures
Tables are defined by rows and columns containing text or numerical data. Figures are defined as any visual element that is not a table. Line graphs, pie charts, photographs, sketches, schematics are all types of figures. In technical documents, a table or a figure—not both—are used to present data. Tables and figures should be understandable to the reader without reference to the text.
Numbering
Tables and figures are numbered independently in the sequence in which they are referred to in the text and start with Table 1 and Figure 1. Note: it is acceptable to abbreviate the word “Figure” as “Fig.” The word “Table” is not abbreviated.
Text Reference
Every figure and table used MUST be referred to in the text. The reference to the figure or table should be informational and draw the reader’s attention to the relationship or trend being highlighted. Text should not flow around a figure or table.
Examples:
Germination rates were significantly higher after 24 h in running water than in controls (Fig. 4).
DNA sequence homologies for the purple gene from the four congeners (Table 1) show high similarity, differing by at most 4 base pairs.
Sentences that only refer the reader to the figure or table and give no information about the data should be avoided.
Table 1 shows the summary results for male and female heights at Bates College.
Placement
Tables and figures should be placed as near as possible to where the data is first referred to in the document. Never split a figure or table on two pages. Multiple figures or tables used in a document should all be similar in style (font style, font size, etc.).
Captions
In written reports, titles are not used on figures or tables; instead, the information is placed in a caption. Captions for tables are placed above the table (typically left aligned), and captions for figures are placed below the figure. NOTE: Titles for figures and graphs can be used for oral presentations and posters.
Captions should contain a number, title, and any other appropriate explanatory information, including citations if the data was taken from another source.
Captions convey information to the reader about the “story” being told with the figure or table. Effective captions should:
- Serve as a brief, yet complete, explanation of the data.
- Can be written as full sentences (using sentence case capitalization) or as fragments (using title case capitalization).
- Tell the reader what to look for.
- Clearly indicate what results are shown in the context of the study.
- Include the unit of representation of data and time period (if appropriate).
- Are typically one font size smaller than the document text.
- Are typically left aligned with the table or graph.
- Clearly indicate what results are shown.
- Include the unit of representation of data and time period (if appropriate).
- Contain a citation if information or data come from another source.
Tables
Tables are used when illustrating exact numbers rather than trends.
Tables should:
- Be discussed and referenced in the text before they appear.
- Contain a correctly formatted and worded caption.
- Be numbered sequentially (but separately from figures).
- Contain short, descriptive, horizontal (preferred) column headings (long column headings can be set at an angle and rotated for reading if necessary).
- Contain units (centered and in parentheses) below the column heading.
- Use horizontal lines sparingly and use no vertical lines.
Example:
The below ground requirements, based on the amount of rock volume needed to sustain plant operations for a 20-year period, are tabulated for a range of plant sizes on a per MWe basis for the surface plant and auxillaries and for the subsurface reservior in Table 1.
Table is disucssed in text prior to table placement.
Caption is usually 1-2 font sizes smaller than text
Table 1. Estimated land area and subsurface reservoir volume needed for EGS development. Note: Above 100 MWe reservoir size scaling should be linear.
Column headings are centered and bolded with the first word capitalized (and poper nouns)
| Plant size (MVe) |
Surface area for power plant and auxiliaries (km2) | Subsurface reservoir volume (km3) |
|---|---|---|
| 25 | 1.0 | 1.5 |
| 70 | 1.4 | 2.7 |
| 75 | 1.8 | 3.9 |
| 100 | 2.1 | 5.0 |
Units included in column heading
Numerical data centered; data containing decimals right aligned (unless easy to center); text left aligned
No vertical lines for simple tables
Horizontal lines used sparingly
Additional guidelines for tables:
- Decimal points should be aligned; otherwise, numbers should be right justified.
- Columns containing text should have left aligned headings and content.
- Columns containing numeric data should have centered headings and content.
- Numeric data containing decimal points should be centered and aligned by decimal point.
Figures
Figures are visual presentations of results, including graphs, diagrams, photos, drawings, source code, and schematics. Engineers have a need to communicate quantitative data, and graphs are the best way to visually represent that data. Graphs, therefore, should require minimal effort on the part of the reader in both understanding and interpreting data.
While there are generally accepted guidelines for creating graphs, opinions differ on best practices. Easy-to-read graphs are not easy to make, and software defaults rarely produce effective graphs. Because graphs are the most common type of figure used by engineers, guidelines for creating effective graphs are discussed below.
Choose the right kind of plot for your data
- Scatter Plots (also known as X-Y Graphs) show the relationship between two or more quantitative variables and are used to show trends or relationships in the data over time. Plot the independent variable on the X axis (the horizontal axis) and the dependent variable on the Y axis (the vertical axis). Points are not connected in a scatter graph.
- Line Graphs are similar to scatter plots in that they record individual data values. The difference is that in a Line Graph a line connects the data points.
- Bar Graphs are used to compare individual sets of data when one of the parameters is categorical, not quantitative. Vertical bars are typically used but horizontal bars can be used when category labels are long.
- Histograms are a type of bar chart where numbers are grouped into ranges. Histograms show the frequency of a continuous data set.
- Pie Graphs are used to show data as a percentage of the total data.
Eliminate unnecessary formatting
Figures should be simple and clear. Grid lines, borders, background patterns, and 3-D effects distract from the message and should generally be avoided. Formatting recommendations include:
- Use a serif font (Times New Roman) if the graph is to be displayed in a written format; use a sans serif font (Ariel or Calibri) if the graph is to be displayed electronically.
- A 10 pt font size is recommended but can range from 8 pt to 12 pt.
- Standardize the format for multiple graphs used in a document.
- Portrait (vertical) orientation is preferred. Figures with a landscape orientation should be oriented so when the reader rotates the figure, the graph reads from left to right.
- Figures should be of high image quality with minimal pixelization.
- If a legend is necessary, place the legend within the axes boundaries. An alternative is to place the legend in the caption.
Examples:
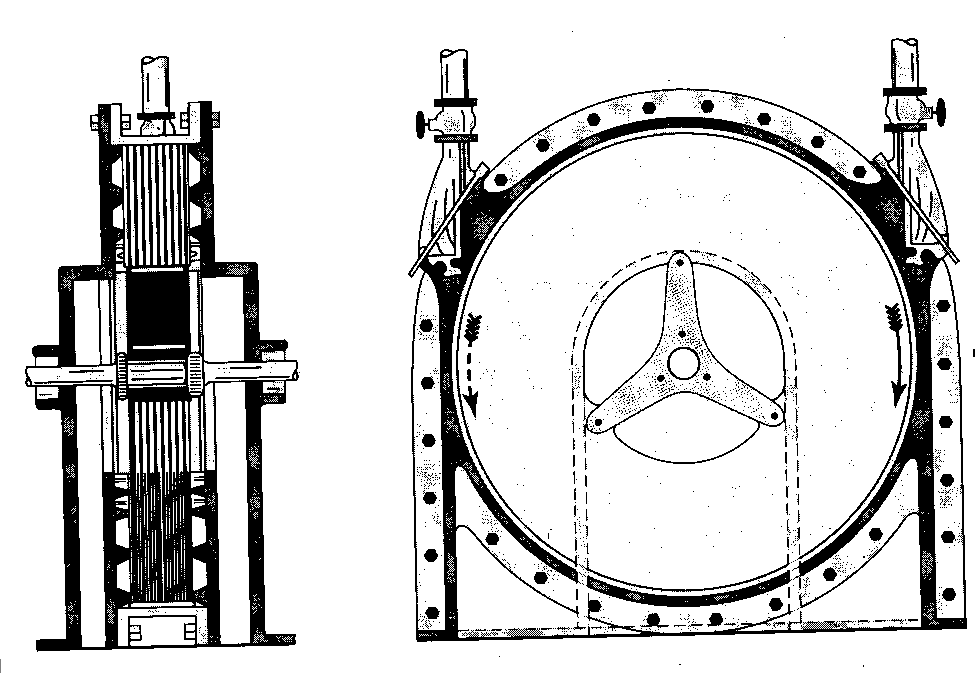
Figure 1. Tesla turbine front and side view [6]. OR Figure 1 Tesla turbine front and side view [6].
NOTE: The word Figure or Table and the associated number are typically bolded. The use of a period after the figure or table number is optional.
Use color carefully. It is generally recommended that color not be used in graphs that will be published or reproduced. Graphs using color when reproduced in black and white will distort the meaning of the data. Eliminate gray-scale shading and patterning. When displaying multiple lines on the same graph, an alternative to using color is to change the line types (solid, dashes, dots, etc.).
NOTE: For poster presentations or PowerPoint presentations, color can be used.
Include all necessary information
Clearly label both axes, including measurement units. Identify symbols and patterns in a legend within axis boundaries (preferably) or in the caption. If the graph has error bars, indicate in the caption whether they are 95% confidence interval, standard error, standard deviation, comparison interval, etc.
Plot data
Although there are few “hard and fast” rules when plotting data, the following guidelines should be observed:
- Plot no more than six data sets on a single graph.
- Select major scale divisions (tick marks) as multiples of 1, 2, or 5.
- Include error bars (SD or SEM) or uncertainty bands when plotting means.
- Provide a legend that identifies data sets. The legend should be placed within the axis boundaries (preferably on the right side of the graph).
- Keep the aspect ratio square unless illustrating variation on the axes.
- Include the origin (zero) on a linear scale (unless the data is best illustrated by changing the origin).
- Label axes clearly and include the units in parentheses (preferred) or square brackets.
- Include an initial zero on numbers less than one.
- Use scientific notation for numbers equal to 104 or greater and for numbers equal to
10-4 or smaller.
- Use closed symbols for data points. Open symbols can be useful for plotting overlapping data.
- Use different line styles to distinguish several curves on the same plot (solid, dashed, dotted).
- Using a line to illustrate continuous data and plotting individual data points using a scatter plot, histogram, or bar chart.
Although Excel produces visually appealing graphs, the software defaults are seldom standard for technical documents. Whenever possible, use graphic software (Kaleidagraph, SigmaPlot).
Works Consulted
Almost Everything You Wanted to Know About Making Figures and Tables, abacus.bates.edu/~ganderso/biology/.../HTW_Guide_Table-Figures_9-30-08.pdf, 2008
(Knisely C.W., and Knisely, K.I. 2015)
Purdue OWL