CIFT
Circularly Invariant Feature Trees
Team: Bradon Lemon
Sponsor: Sandia National Laboratories
Project
The Bode Description Project implemented a random forest Machine Learning model from decision trees to identify and classify targets within an image. Correct development of this AI model will utilize an FFT to obtain a rotationally invariant feature within the model and allow for efficient usage of time and hardware while giving an accurate depiction within the model.
A common problem among image analysis is how rotational variance affects the model. A car, airplane, etc. may be oriented any which way. Running every possible orientation costs RAM, computation, and time. The problem is to develop a model that has rotationally invariant qualities, such that the model may identify the same target at any other orientation.
System
True Positive

True Negative
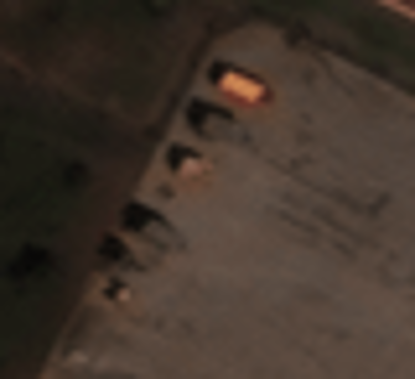
False Positive

All Targets were identified, so there are no examples of a false negative.
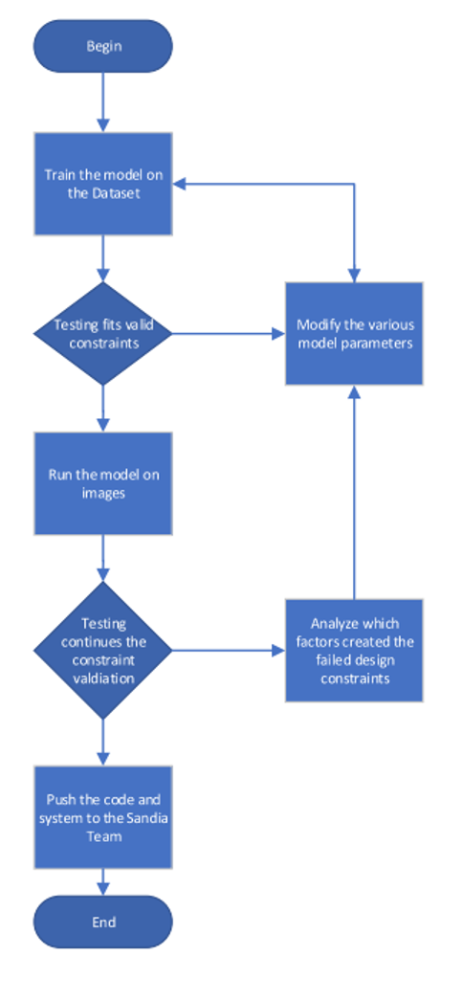
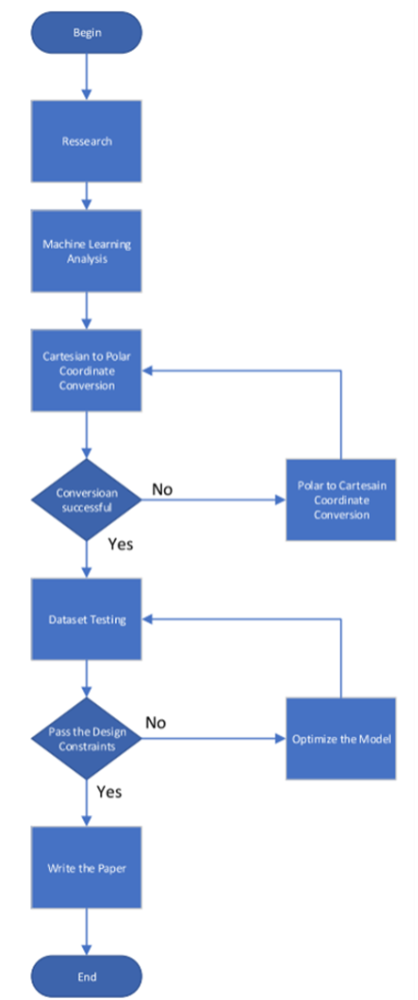
Methods
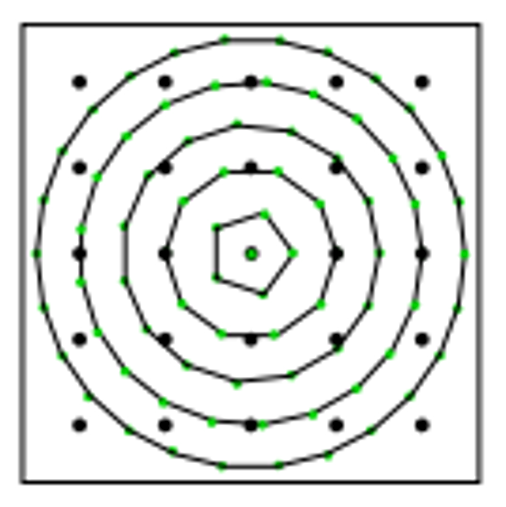
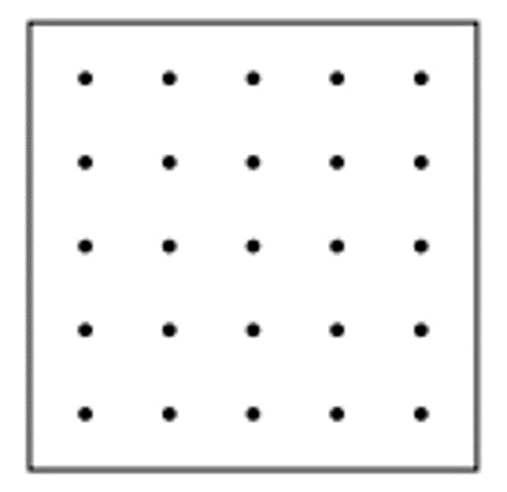
Polar to Cartesian Coordinate Conversion
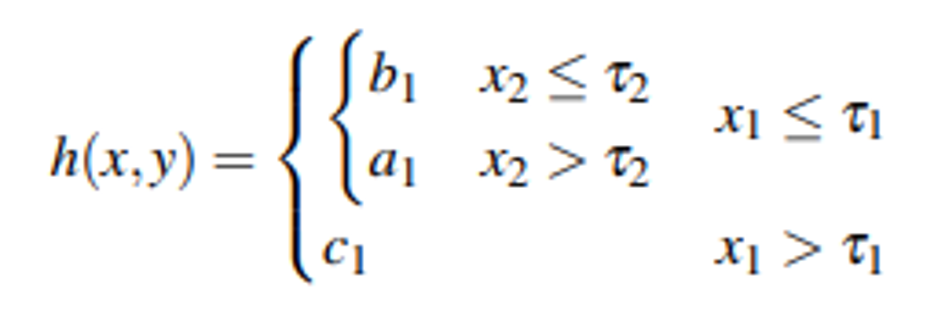
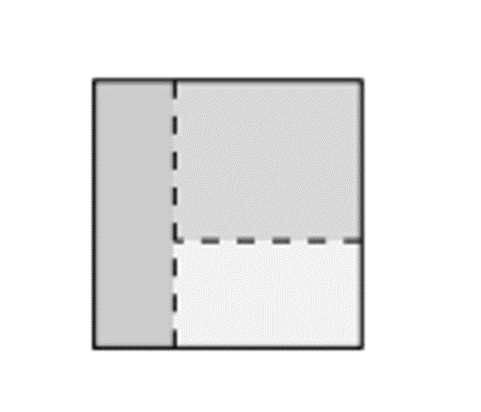
A tree contains several layers to output a value dependent on the input values. The model employs several trees to form a forest. The output from these trees is put into a vector of scalar values to weigh the outputs and determine a positive or a negative detection.
An FFT is then applied to give the model its rotationally invariant feature.
Conclusion
The model takes 2.15 hours to scan an image—employing a parallel architecture over 36 CPUs.
The chosen parameters were then determined to be 1.4 radii increments, 1.65 arc length increments, and a sub-image size of 25×25. This performs well while maintaining a precision and recall optimization.
| Radius | Arc Length | Points | Precision | Recall | F1 score | ConfusionMatrix |
| 0.5 | 0.5 | 1873 | 87.253597 | 89.253597 | 88.183029 | 1985 293 239 3633 |
| 1 | 0.5 | 825 | 87.472527 | 89.478417 | 88.464103 | 1990 285 234 3641 |
| 0.5 | 1 | 931 | 87.43897 | 88.579137 | 88.005361 | 1970 283 254 3643 |
| 1 | 1 | 410 | 87.158836 | 87.589928 | 87.373851 | 1948 287 276 3639 |
| 1.5 | 1 | 261 | 87.088156 | 87.94964 | 87.516778 | 1956 290 268 3636 |
| 1 | 1.5 | 272 | 87.730871 | 89.703237 | 88.706091 | 1995 279 229 3647 |
| 1.5 | 1.5 | 173 | 86.883059 | 87.859712 | 87.368656 | 1954 295 270 3631 |
| 2 | 2 | 93 | 86.602027 | 88.354316 | 87.469397 | 1965 304 259 3622 |
Table 3-2. Multi-class Classifier: Performance as a function of tree depth and number of trees
| Tree Depth | # of trees | Subimage Size | Radius | Arc Length | Precision | Recall | F1 Score | Score |
|---|---|---|---|---|---|---|---|---|
| 4 | 1000 | 25 | 1.4 | 1.65 | 98.22 89.6 | 96.82 85.36 | 97.51 87.43 | 94.9 |
| 5 | 1000 | 25 | 1.4 | 1.65 | 99.18 80.87 | 97.69 84.05 | 98.4286 82.4313 | 96.58 |
| 6 | 1000 | 25 | 1.4 | 1.65 | 98 89 | 95.7 85.698 | 96.85 87.53 | 93.35 |
| 5 | 800 | 25 | 1.4 | 1.65 | 99.65 11.111 | 88.544 33.333 | 93.77 40 | 86.94 |
| 5 | 1200 | 25 | 1.4 | 1.65 | 99.34 20 | 93.25 66.666 | 96.2 30.769 | 91.99 |